
Operational visibility is the ability to see what is happening across your routes, trucks, crews, customers, and cash while there is still time to act on it. Large waste companies build it over decades with connected systems. Many smaller haulers run on disconnected software and spreadsheets, and the fix starts with pulling that data into one place.
What does Michael Jordan's bus have to do with waste operations?
In 1994, playing minor league baseball for the Birmingham Barons, Michael Jordan bought the team a new luxury bus. It was generous, and it was also practical: he was used to charter jets. Operators who move from large waste companies to small haulers go through the same thing with data. You notice what you had once it's gone.
Everyone assumed the bus was pure generosity, and it was. But Jordan had spent years flying between NBA cities, and a Double-A road trip in a school bus was a hard reset. He bought back a little of what he'd lost.
I've led operations at large waste companies with more than $1B in revenue, and at small haulers. The biggest difference between the two isn't the trucks, the people, or the customers. It's access to data.
Jordan understood the value of comfort the moment he no longer had it. I understood the value of operational visibility the same way.
Paul Marker, President & Co-Founder
What do large waste companies have that small haulers don't?
Large waste companies have connected systems: routing software, fleet tracking, billing and ERP platforms, and dashboards that flag a problem before a manager has to ask. The gap is rarely effort or talent. It's decades of investment in making those systems talk to each other, so the numbers are already reconciled when the morning meeting starts.
Move to a smaller company and that infrastructure is often missing. You can no longer rely on the systems and processes you took for granted. The patterns are familiar to anyone who has made the move:
- Routes live in someone's head. A senior dispatcher knows which stops run long and why, and that knowledge isn't written down anywhere a report can reach.
- Every system is an island. Billing sits in one platform, routing in another, payroll in a third, and safety incidents in a spreadsheet.
- The P&L arrives late. Month end closes, and the picture of how the month went shows up weeks later, long after anyone could change it.
- Two people, two numbers. Operations and finance each pull their own version, and the meeting turns into a debate about whose spreadsheet is right.
None of that means the smaller operator is doing a worse job. It means they're doing the same job without instruments, and you have to build those instruments yourself.
Why does disconnected data slow a waste operation down?
Disconnected data turns every question into a project. When billing, routing, labor, and safety live in separate systems, someone has to export, paste, and reconcile before anyone can see lifts per hour or labor cost against revenue. By the time the report is ready, the week it describes is over and the decision it should have driven was made.
That cost shows up in three places:
- Time. Manual Excel reporting steals hours from the people who should be running the operation. The same exports get rebuilt every week, by hand, with the same risk of a broken formula.
- Trust. When the number changes depending on who pulled it, nobody acts on it with confidence. Decisions default back to gut feel, which is exactly what the report was supposed to replace.
- Timing. A route running over its hours, a commercial account 90 days past due, or a driver with repeat incidents are all fixable problems. They are much more expensive when you find out about them at month end.
What happens when you pull your operational data together?
Three things happen, in order:
- Data quality problems surface. Integration exposes the problems your systems have been carrying, like missing service records or mismatched customer accounts.
- The gaps become visible. Those problems point straight at the operational gaps behind them.
- Decisions get faster. With trusted numbers and the gaps in plain view, nobody waits on a month-end report to act.
The dashboard is the visible part. The connected data underneath is what makes it work.
This is the part most dashboard projects skip. Connecting a billing system to a routing system for the first time almost always turns up records that don't match. A stop being serviced that isn't being billed, a customer billed for a container size they no longer have, or labor hours coded to a route that no longer exists. Each mismatch is a finding. Fix the data and you usually fix a process at the same time.
The payoff is efficiency you can measure. On a Power BI reporting build Kyle Fredette, our CTO and Co-Founder, led for a national portable services operator, an accounts receivable dashboard helped cut receivables by $1M in a single month. The receivables were always there. The visibility wasn't.
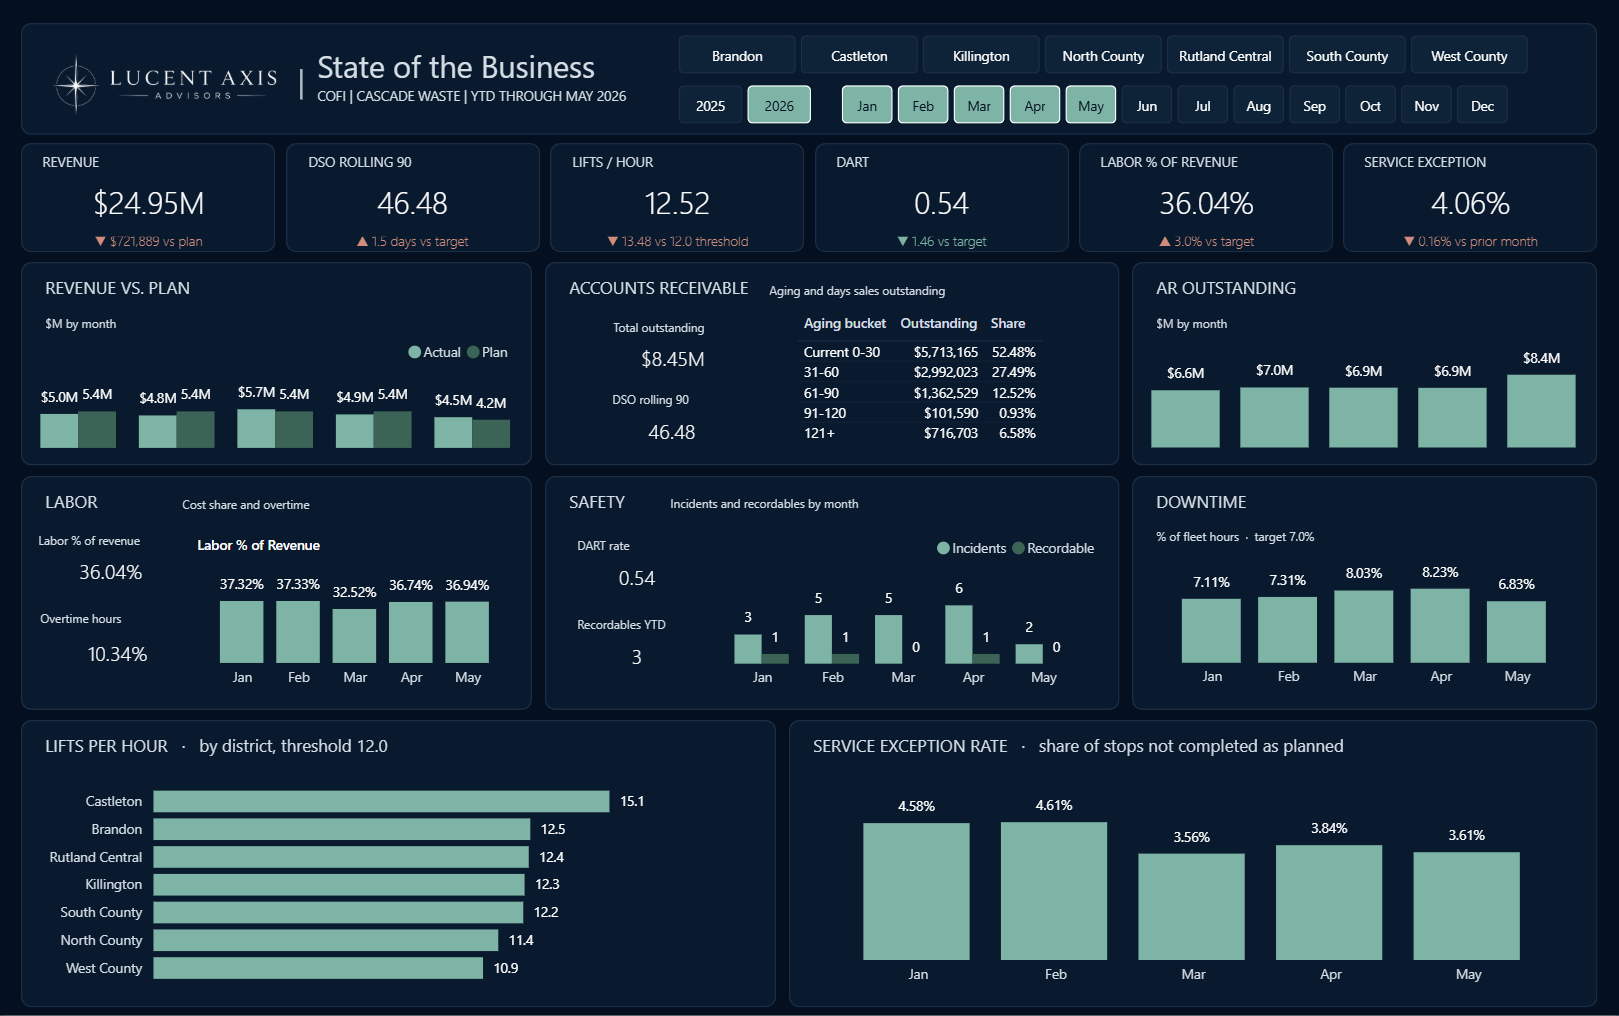
Which KPIs should a waste hauler track first?
Start with six: revenue, days sales outstanding (DSO), lifts per hour, labor as a percent of revenue, service exceptions, and a safety rate such as DART. Together they cover whether you're growing, getting paid, running routes efficiently, controlling one of your largest costs, keeping customers, and keeping crews safe. Most of them need data from more than one system.
| KPI | What it tells you | Where the data lives |
|---|---|---|
| Revenue | Whether you're growing, and which lines of business drive it | Billing or ERP |
| Days sales outstanding (DSO) | How fast completed service turns into cash | Billing and accounts receivable |
| Lifts per hour | Route productivity, truck by truck and driver by driver | Routing or onboard system, plus time and labor |
| Labor as a percent of revenue | Whether crew cost is in line with what the routes bill | Payroll plus billing |
| Service exceptions | Missed pickups, blocked containers, and the other failures customers notice first | Routing or onboard system, plus customer service |
| DART rate | Injuries serious enough to cause days away, restricted duty, or a job transfer, per 200,000 hours worked | Safety and HR records, plus hours worked from payroll |
Look at the right hand column. Only revenue comes from a single system. Every other metric on the list needs two sources stitched together, which is why a hauler with good software can still have no reliable read on lifts per hour or labor efficiency.
Do small haulers need enterprise software to get this visibility?
No. Many haulers already own the systems they need: a billing or ERP platform, a routing tool, payroll, and some form of safety tracking. What's missing is the layer that connects them and defines each metric once. That layer can be built on tools like Power BI, sized to the operation, without replacing the software your team already knows.
"Defines each metric once" matters more than it sounds. If lifts per hour means one thing to dispatch and another to finance, the dashboard just moves the argument to a new screen. A written metric dictionary, one definition per KPI with the source and the formula, is what lets a 40 truck operation and a 400 truck operation read their numbers with the same confidence.
Where should a small hauler start?
Start with one question you can't answer today without a spreadsheet, such as which routes lose money or which customers pay late. Trace where the data for it lives, connect those sources, and agree on one definition. Solve that one well, then add the next question. Visibility is built a question at a time, not in one big rollout.
- Pick the question. Choose the one that costs the most to not know. For most operators that's route profitability, collections, or labor.
- Map the sources. List every system that holds a piece of the answer, and who owns each one.
- Connect and clean. Bring the sources together and treat every mismatch you find as a finding, not an inconvenience.
- Put it in front of the people who act on it. A daily view for dispatch and operations, a weekly review with leadership, and one agreed number on the screen for both.
Jordan didn't wait for the Barons to earn a better bus. He saw what was missing and bought it back. You don't need decades to build the visibility the large operators have. You need your existing data, connected, and trusted.
Frequently asked questions
What is the difference between operational visibility and operational reporting?+
Operational reporting tells you what happened, usually after the period is closed. Operational visibility is the same data, connected and current enough to act on while the week is still running. A route running long or a customer paying late shows up in time to do something about it.
Will connecting our systems expose problems in our data?+
Almost certainly, and that is a good outcome. Missing service records, duplicate customer accounts, and labor hours coded to the wrong route are common. Each one is a finding that points at a process gap, and fixing it is part of the work, not a detour from it.
Do we have to replace our routing or billing software?+
Usually not. The goal is to connect the systems your team already uses and define each metric once, not to force a platform change. If a system genuinely cannot provide the data you need, that becomes a separate, clearly scoped decision.
Is this only for waste companies?+
No. Lucent Axis is built for waste, transportation, and logistics. Any fleet based operation with routes, crews, equipment, and customers to bill runs into the same disconnected data problem, and the same approach applies.

Paul has spent 15+ years in the waste industry. His executive operating roles span WIN Waste Innovations, Rumpke Waste & Recycling, Advanced Disposal, Waste Management, and Iron City Waste Holdings. He is a CPA and MBA. This article expands on a post Paul shared on LinkedIn.